Camera Health Summary
Total, active, and inactive camera metrics with health alerts, downtime logs, and field-team maintenance assignments — all in one live status board.
Our Management Information System (MIS) offers real-time dashboards and detailed reports for traffic, enforcement, revenue, and infrastructure metrics. Built for clarity, it brings together multi-source data to power high-level decision-making across departments.
From city civic authorities to single-campus admins — MIS delivers the right view of operations to every stakeholder who depends on traffic, safety, and revenue data.





Each dashboard rolls up live data from cameras, sensors, enforcement platforms, and field teams — giving every department a single, consistent source of truth.
Total, active, and inactive camera metrics with health alerts, downtime logs, and field-team maintenance assignments — all in one live status board.

Daily vehicle counts categorized by vehicle type, speed trends, and congestion insights — pinpoint chronic bottlenecks before they become incidents.
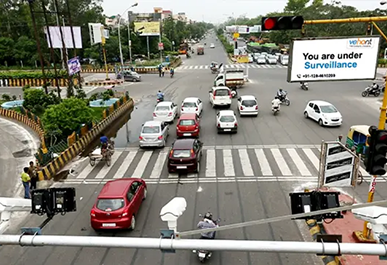
Total violations with a breakdown by type (speeding, signal jump, etc.), challan counts, and auto-tagged video records for every flagged event.
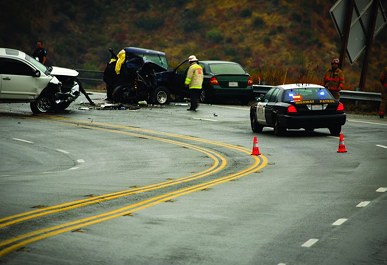
Logged incidents with timestamps, location, type, resolution status, and direct links to the video evidence that triggered or documented the response.

Total eChallan issued, paid/unpaid split, penalty breakdowns, and daily and monthly enforcement-revenue trends to drive collection priorities.

Response time, system uptime, CCC escalation rate, alert-handling efficiency, and inter-agency SLA compliance — track the health of the whole operation.
Each capability is independently deployable — adopt them one at a time or roll out the full MIS reporting stack. Pick a capability on the left to see what it includes.

Daily vehicle counts and peak-hour breakdowns.
Speed and flow heatmaps to surface chronic congestion.
Comparative zone-wise traffic trends over any timeframe.
From decision-makers to field teams, MIS centralizes insights so every stakeholder acts with clarity. Automate your performance tracking and optimize your city's traffic, safety, and operational efficiency from a single console.

Run MIS reports at any level — from broad municipal dashboards to localized hotspot analytics for traffic police or control-room officers. Slice the same data citywide, by zone, or down to a single junction.
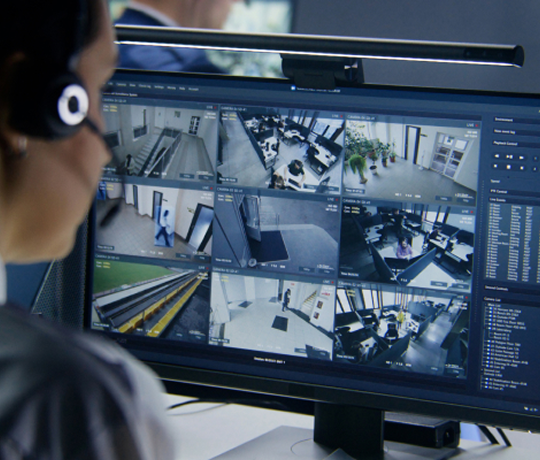
MIS is tuned for the people who run the city — from the command center down to the patrol officer. Wherever decisions about traffic, safety, or revenue get made, MIS hands the right view to the right team.
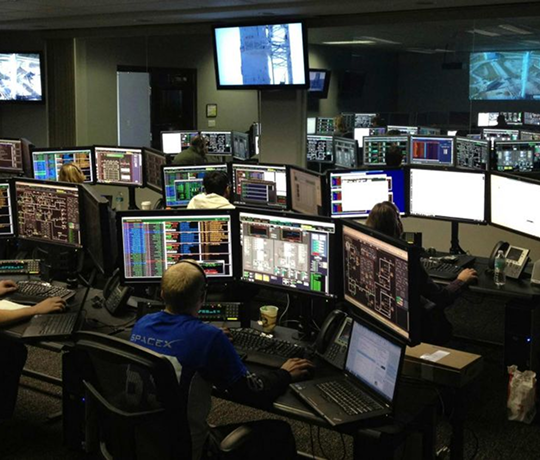
MIS integrates data from GIS, EMS, CCC, VMS, eChallan portals, and enforcement mobile apps — providing a single window of truth that every department reads from and writes back into.