
Cart is empty
The 80/20 Problem in Public Transport: Why a Small Number of Routes Can Carry Most of the Demand
14/08/2026
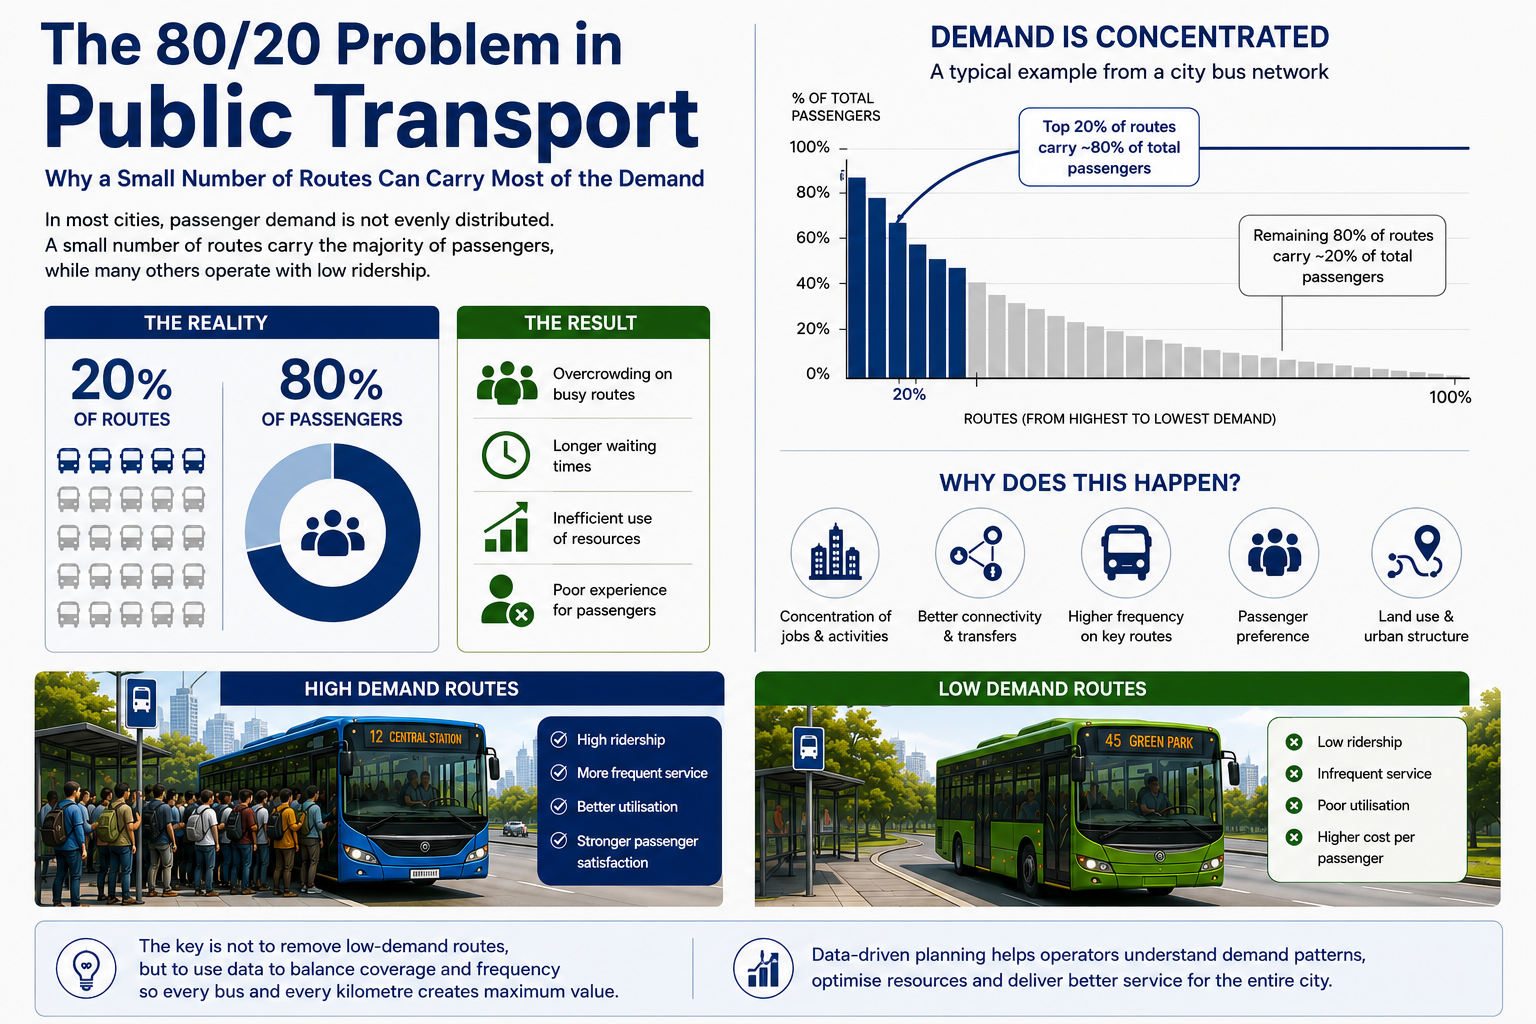
Look at almost any large public transport network and you will find something interesting.
Not every route is equally busy.
Some routes carry passengers throughout the day. Buses on these corridors leave the depot full, reach busy stops with standing passengers, and continue carrying strong demand from one end of the route to the other.
Then there are routes where buses operate with plenty of empty seats.
The operator may have a similar number of buses running across both types of routes, but the passenger demand can be completely different.
This is where the 80/20 principle, also known as the Pareto principle, becomes an interesting way to think about public transport.
The idea is simple: a relatively small share of routes can account for a disproportionately large share of total ridership.
But there is an important distinction.
Public transport does not follow a universal rule that says exactly 20% of routes will always carry exactly 80% of passengers. The actual distribution depends on the city, network design, population density, employment centres, route frequency, transfers, road structure and many other factors.
What is consistent is the underlying phenomenon:
Passenger demand is rarely distributed evenly across a transport network.
And understanding why can change the way a city plans and operates its buses.
Why Does Demand Concentrate on Certain Routes?
The first reason is geography. People do not travel randomly around a city.
Large numbers of passengers usually move between places such as residential areas, business districts, railway stations, universities, industrial areas, shopping centres and major transport hubs.
When several important destinations are connected by the same corridor, demand naturally starts concentrating there.
A route passing through a major employment zone may carry thousands of passengers every day, while another route serving a lower-density residential area may carry considerably fewer.
This is not necessarily a sign that the second route is badly planned. It may simply be serving a different purpose.
Frequency Creates Another Effect
There is another important reason some routes become stronger than others: frequency.
Imagine two bus routes. Route A has a bus every 7 minutes. Route B has a bus every 25 minutes.
Even if both routes serve areas with similar populations, passengers may prefer Route A because they do not have to plan their journey around a specific departure.
Higher frequency reduces waiting time and makes a service more convenient.
Research on bus ridership has found that frequent routes can serve more passengers per trip than lower-frequency routes, while also showing that the relationship between additional frequency and ridership is not unlimited. In other words, frequency matters, but each additional bus does not necessarily produce the same increase in passengers.
This creates an interesting feedback loop. More demand can justify more frequency. More frequency can attract more passengers. And that can make an already strong corridor even stronger.
The Network Effect
A bus route should not always be viewed as an isolated line. It is part of a network.
A route that connects with a metro station may generate more passengers because it acts as a feeder.
Another route may connect two major bus terminals. A third may cross several important corridors and become a transfer point. The value of a route therefore depends partly on what it connects to.
Research on bus network structure has shown that network design itself can significantly shape demand. A study of Barcelona's network found that a transfer-friendly network could attract additional demand, with transfers becoming an important part of how passengers used the system.
This is an important lesson:
A busy route is not necessarily busy only because of the places directly along it. It can also be busy because of the connections it creates.
Why Bengaluru Is a Good Example of the Complexity
The phenomenon becomes even more interesting in large Indian cities.
Research on Bengaluru developed a detailed bus ridership demand model and found that ridership is influenced by several factors, including service frequency, stop-level characteristics, land use and relationships between different bus routes and the Metro network. The researchers also found that the impact of service frequency on ridership is non-linear.
That means an operator cannot simply look at yesterday's passenger numbers and say:
"This route carried 10,000 passengers, so let's add more buses."
There is more to the decision. The operator needs to understand why the route is busy.
- Is it because of a major employment centre?
- Is it because the route connects with a railway station?
- Is it because passengers have no practical alternative?
- Is the route frequent enough to attract spontaneous trips?
- Is it carrying passengers who are transferring from another service?
These questions lead to better planning decisions.
The Problem with Treating Every Route Equally
Suppose a transport authority has 1,000 buses available. It could distribute them evenly across its routes.
On paper, that might appear fair. Operationally, it may not be the best use of resources.
A high-demand corridor receiving too few buses could experience:
- Overcrowding
- Long queues
- Longer boarding times
- Increased dwell time
- Passenger dissatisfaction
- Lost potential ridership
At the same time, a low-demand route might continue operating with excess capacity. This does not mean low-demand routes should simply be cancelled. Public transport has a social role.
Some routes exist because people depend on them even when passenger numbers are relatively low.
The real challenge is finding the right balance between coverage and frequency.
Research into route concentration has highlighted exactly this trade-off: concentrating service on major corridors can improve frequency and potentially increase ridership, but reducing route coverage can also increase walking distances for passengers.
The 80/20 Principle Is Not an Excuse to Ignore the Other 80>#/b###
This is where the Pareto idea needs to be handled carefully.
If an operator discovers that a small number of routes generate most of its ridership, it should not automatically conclude that the remaining routes are unnecessary.
A low-ridership route may still provide:
- Essential connectivity
- Access for underserved communities
- Feeder connections
- First- and last-mile access
- Off-peak mobility
- Accessibility to hospitals, schools or employment areas
Public transport isn't purely a commercial business. A route carrying fewer passengers can still have significant social value. The goal is therefore not simply to remove low-demand routes. The goal is to understand the role and cost of every route.
What Operators Should Look At
Instead of asking only "How many passengers use this route?", planners can look at the complete operating picture.
Important measures include:
- Passenger demand by route and time of day
- Passengers per trip
- Load factor
- Service frequency
- Average waiting time
- Peak and off-peak demand
- Route overlap
- Transfer activity
- Vehicle utilisation
- Cost per passenger trip
- Demand by stop and corridor
This produces a much clearer picture than a simple ranking of routes.
Why Demand Concentration Changes During the Day
Another important point is that the 80/20 pattern is not necessarily fixed. A route that is extremely busy at 8:00 AM may be relatively quiet at 2:00 PM. An industrial corridor may peak around shift changes.
A university route may have a completely different demand pattern from a residential route. An airport or railway connection may experience demand based on arrival and departure patterns.
This means that route-level averages can hide important operational information.
The real question is not just:
"Which routes are busiest?"
It is:
"Which routes are busiest, when are they busiest, and why?"
Where Technology Becomes Useful
This is where modern public transport management moves beyond simple fleet tracking.
GPS can tell an operator where a bus is. Ticketing systems can provide passenger transactions. Passenger counting systems can show boarding and alighting patterns. Scheduling systems show planned service. Maintenance systems show vehicle availability.
But the real value comes when these different sources can be viewed together.
An operator can then compare:
Planned service → Actual service → Passenger demand → Fleet availability → Route performance
That makes it possible to identify where resources are being used effectively and where operational changes may create greater value.
How RouteSync Can Help
For a modern transport authority, this type of analysis requires more than a list of routes and buses.
RouteSync, by Arena Softwares, brings together key areas of public transport operations, including fleet management, scheduling, vehicle tracking, depot operations and operational analytics.
By connecting operational information, RouteSync can help transport teams gain a clearer view of how vehicles are being used, how services are performing and where operational decisions may have the greatest impact.
The objective is not to apply an arbitrary 80/20 rule.
It is to understand the actual distribution of demand across the network and use that information to make smarter decisions about service, frequency, fleet utilisation and passenger experience.
The Bigger Lesson
The most important lesson behind the 80/20 idea is not the number 80 or the number 20. It is the uneven distribution of demand.
A transport network may contain hundreds of routes, but passenger movement is often concentrated around particular corridors, destinations and connections.
That creates both a challenge and an opportunity. If operators spread resources without understanding demand, busy corridors can become overcrowded while other services operate below capacity.
If they concentrate everything on the busiest routes, they may sacrifice network coverage and accessibility.
The answer lies somewhere in between.
Modern public transport planning needs to understand not only where passengers are travelling, but also why they are travelling there, when demand changes, how routes interact, and what happens when service levels change.
The 80/20 principle provides a useful starting point.
The data provides the real answer.
And for cities trying to move more people with limited road space, limited budgets and limited fleets, understanding that difference can make every bus—and every kilometre—work harder.
34
 Facebook
 Instagram
 LinkedIn
 YouTube