How MIS and Data Visualisation Are Redefining Decision-Making

In this fast-paced digital age, the process of making decisions has become more time-sensitive and complicated than it has ever been. Organisations, whether private or governmental, process a tremendous level of data each day. Data alone is never responsible for yielding results; the true strength lies in the way that it is structured, decoded, and utilised to generate informed decisions. This is where Data Visualisation and Management Information Systems (MIS) intersect to change the manner in which the organisation functions and makes strategic decisions.
MIS and data visualisation technologies have revolutionised the manner in which leaders experience their operations, their level of performance, and their plans. Through the derivation of useful insights from raw data, the disconnect between raw data and informed choices is narrowed.
Information System: Pillar of Modern Decision-Making
A Management Information System (MIS) is a formal system that captures, processes, and stores information to help make decisions in an organisation. It brings together data from various departments—you name it: finance, operations, logistics, and human resources—all under a single system. The result is that the deciders get real-time, reliable information in their palms.
Earlier, information was gathered using static spreadsheets and cumbersome manual reporting. Now, using the MIS, these activities are mechanised and are provided quickly and precisely. Executives are able to monitor performance in real time, identify bottlenecks, and take corrective action.
MIS is also not limited to the management of corporations themselves. It has become a part of the management of intelligent cities, university campuses, transportation infrastructure, healthcare delivery systems, and any such setup where large data need to be converted into time-sensitive decisions.
The Strength of Data Visualisation
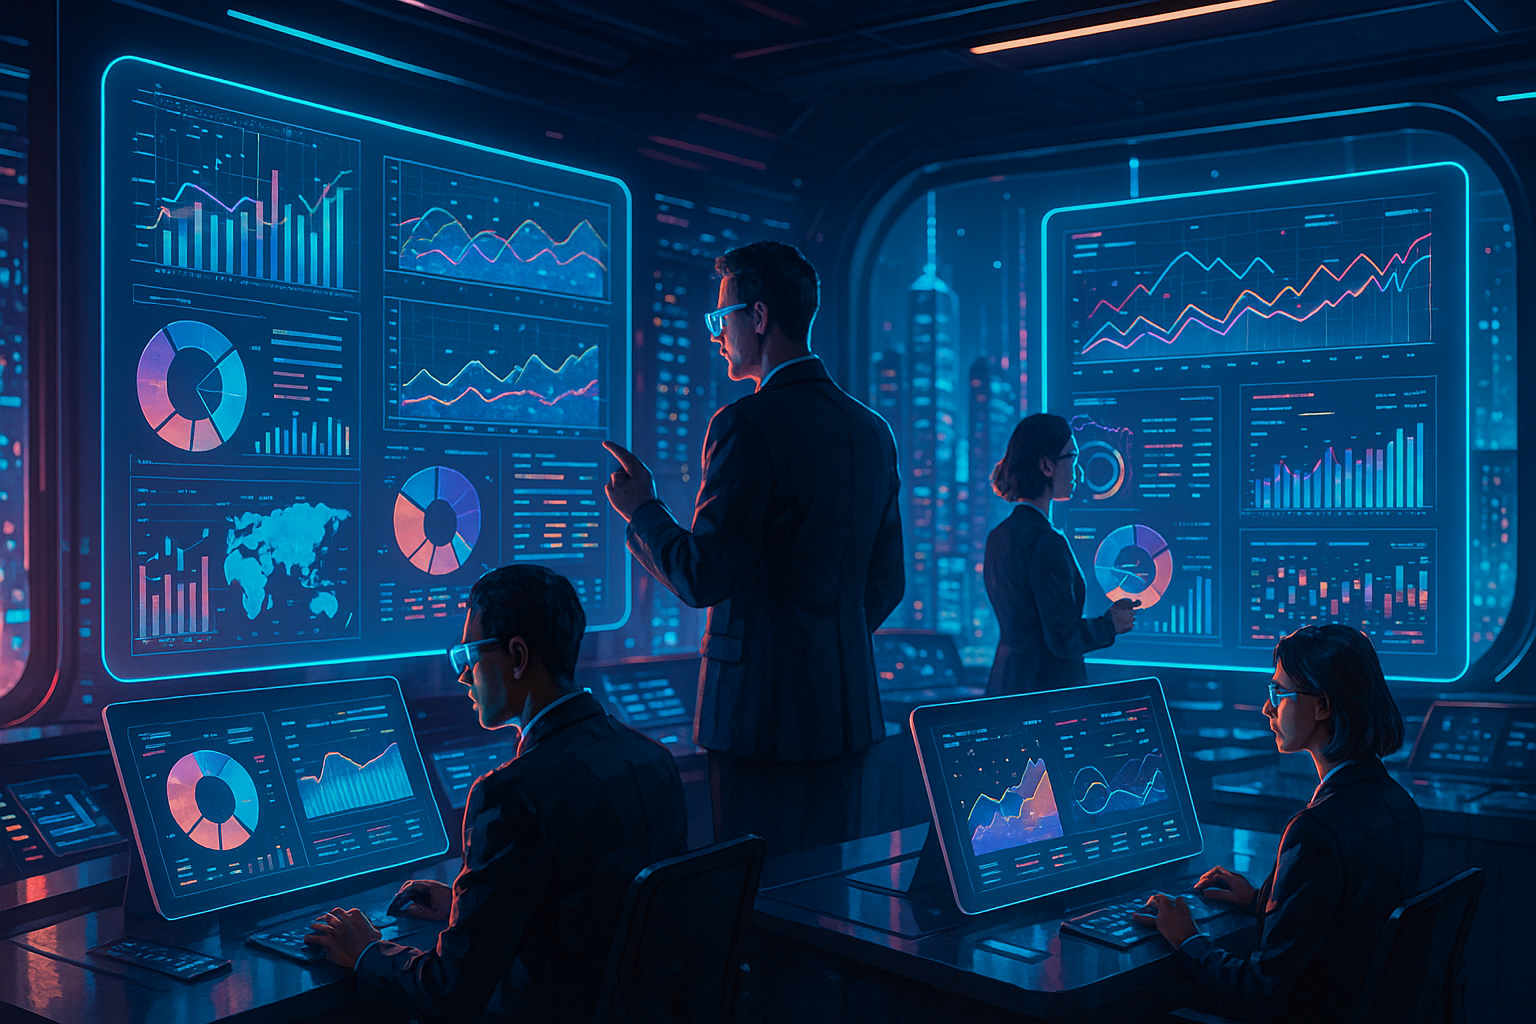
Whereas the MIS supplies the information, data visualisation renders it understandable and compelling. Visualisation converts cumbersome datasets into charts, graphs, dashboards, and maps that identify patterns, trends, and outliers instantaneously. This graphical simplicity enables the decision-makers to absorb insights more quickly than by delving into voluminous reports.
When aligned with MIS, visualisation software acts as a data storytelling platform. A city administrator, for example, will be able to visualise real-time traffic movements through a GIS-enabled dashboard, while a transportation company will be able to view route efficiency in real time. Organisations are able to notice things early, identify opportunities and make proactive choices by confidently expressing data in a pictorial way.
Data visualisation also facilitates collaboration. Rather than reading data differently, departments' workgroups can see the same images and have a joint understanding and concerted action.
The Combined Impact: From Data to Decisions
In combination with the power of data visualisation, they form a strong ecosystem for decision intelligence. The MIS keeps the data current, accurate, and in the proper format, while visualisation turns that data into interactive and easy-to-understand views.
This pairing allows organisations to:
- Switch from reactive management to predictive planning.
- Make base decisions using real-time analysis instead of guesswork.
- Identify hidden patterns otherwise not recognised in raw data.
- Convey insights effectively across the whole organisation.
For example, in transportation operations management, a joint MIS and visualisation system may manage vehicle utilisation, maintenance schedules, and driver performance on interactive dashboards. This minimises operational expenses while achieving enhanced efficiency and effectiveness.
Facilitating Data-Driven Culture
Modern organisations thrive on a data-driven culture where all operational and strategic decisions are guided by prudent data insights. Data visualisation tools and information technology enable leaders to take action confidently by accurately assessing the outcomes.
A data culture also ensures transparency, accountability, and continuous improvement. Managers no longer rely on gut instinct or aged reports—they have real-time insight into the impact of their decisions. It means better performance, better-optimised resources, and greater agility when conditions change.
Furthermore, when AI and machine learning are included in the MIS and visualisation infrastructure, the decision-making will become even more evolved so that predictive and prescriptive levels of analysis are possible. This allows organisations to know not just what is occurring today but also things that are likely to occur tomorrow and the optimal response.
Conclusion: Empowering Smarter Decisions with Arenasoftwares
In a world where every decision counts, the integration of MIS and data visualisation stands at the core of intelligent management. Together, they empower organisations to make faster, smarter, and more strategic choices—backed by real-time data and visual clarity.
At Arenasoftwares, we specialise in delivering advanced MIS and visualisation solutions tailored to diverse industries. Our platforms are designed to simplify data complexity, enhance operational transparency, and support informed decision-making at every level. Whether for transport management, enterprise operations, or smart city initiatives, Arenasoftwares provides the intelligence that helps organisations move forward with confidence. Data is the new currency of success—and Arenasoftwares is here to help you make every data point count.
